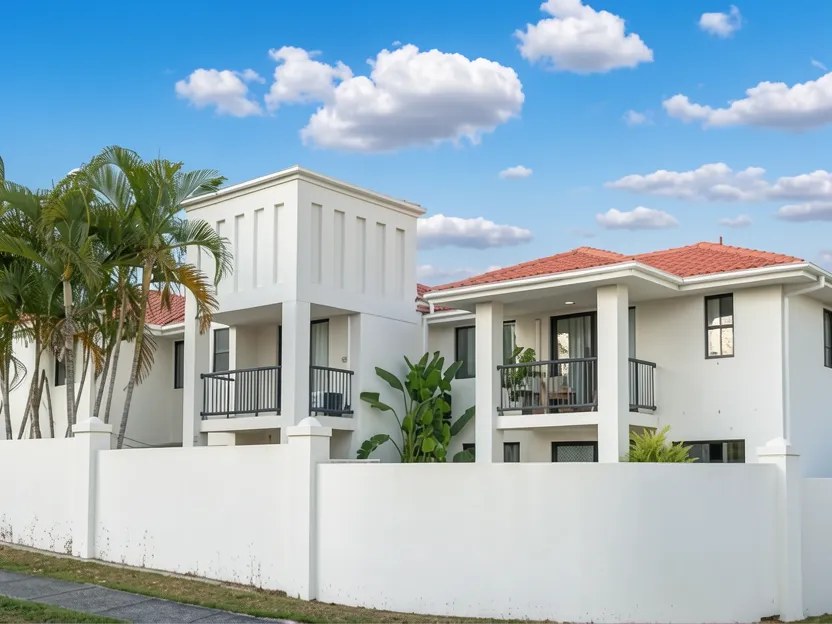
Experience resort-style living in this secure Heights complex corner villa, featuring high ceilings, new kitchen cabinetry, and a spacious courtyard with established gardens. Perfect for families or investors seeking a low-maintenance lifestyle with access to a gym, pool, and spa. Contact agent for price details.
Description
This beautifully presented three-bedroom corner villa offers the space, privacy and outdoor living of a freestanding home—all within the secure and highly regarded Heights complex. Perfectly positioned at the front of the complex with only one adjoining neighbour, the property enjoys a commanding corner position and a large, sun-drenched courtyard. With established gardens, artificial turf and a grassed backyard, there is plenty of room for children, pets and relaxed outdoor entertaining. Step inside and be welcomed by impressive high ceilings that create an immediate sense of light, space and character. The generous open-plan living and dining area is complemented by stylish tiles, elegant sheer curtains and a fresh, contemporary natural palette. The open-plan kitchen features new cabinetry, excellent storage and a practical layout overlooking the living spaces—perfect for everyday family life and entertaining. Three generously sized bedrooms provide comfortable accommodation, with the master bedroom opening onto a large private balcony. Two bathrooms, three toilets, a separate laundry and a convenient downstairs powder room complete this practical and spacious floor plan. The covered outdoor entertaining area is ideal for weekend BBQs, sunset drinks or a peaceful morning coffee while enjoying the private and tranquil garden setting. Whether you are searching for a low-maintenance family home, a stylish downsizer or a quality investment property, this feature-packed villa is sure to impress. Features of the home include grassed backyard with established, easy-care gardens, covered outdoor entertaining and BBQ area, light-filled open-plan living and dining, impressive high ceilings, stylish natural stone tiles throughout, elegant sheer curtains, open-plan kitchen with new cabinetry, three generously sized bedrooms, master bedroom with a large private balcony, two bathrooms and three toilets, convenient downstairs powder room, separate internal laundry, split-system air conditioning and ceiling fans upstairs and downstairs, secure lock-up garage, private, secure gated community, pet friendly & low body corporate. Perfect to live in or an excellent investment opportunity. OUTGOINGS: Low Body Corporate approx $112 per week & bring your fury friends they are welcome too! Council Rates: Approx. $1,850 per annum Water Rates: Individually metered – approx. $1,400 per annum RESORT-STYLE FACILITIES: The Heights is a secure and private boutique complex offering residents an impressive selection of recreational facilities, including swimming pool and spa, fully equipped gymnasium, sauna, BBQ and entertaining area, recreation room, children's play area. Conveniently located in a peaceful street close to schools, shops, golf courses, parks and public transport. Westfield Helensvale and the light rail are also nearby, providing easy access to the beaches, hospitals, university and the M1. Private, stylish and wonderfully spacious—this is the one you have been dreaming of. LOCATION: Arundel offers an exceptional opportunity to live among prestigious homes set on wide, landscaped streets, surrounded by parks, playgrounds, national parkland, and wetlands. Enjoy underground power and a peaceful, family-friendly community, all within a close proximity to key Gold Coast amenities. Griffith University, Gold Coast Public and Private Hospitals, Gold Coast Academy, AB Paterson College and Arundel State School are all nearby, local shopping villages, Harbour Town Shopping Centre, quick and easy access to the M1 motorway, both North and South and the Gold Coast Light Rail, the beautiful Broadwater is just a short drive away, perfect for walking, boating and water activities.
Property Style & Condition
Overall
contemporary
excellent Condition
Exterior
modern
good Condition
Livingroom
contemporary
excellent Condition
Bedrooms
modern
excellent Condition
Kitchen
contemporary
excellent Condition
Bathroom
contemporary
good Condition
Yard
landscaped
excellent Condition
Key Features
Corner position in secure Heights complex
Three bedrooms with master opening to private balcony
Two bathrooms and three toilets including powder room
Open-plan kitchen with new cabinetry
Impressive high ceilings
Stylish natural stone tiles throughout
Covered outdoor entertaining area with BBQ
Grassed backyard with established gardens
Split-system air conditioning and ceiling fans
Secure lock-up garage
Resort-style facilities (pool, spa, gym, sauna)
Low body corporate ($112/week approx.)
Specifications
Property Details
Property TypeVilla
Stories2
Parking Typeattached garage
Constructionbrick
Windowsdouble pane
Internetnbn
Location & Setting
Settingsuburban
Lot Positioncorner lot
Beach Proximityshort drive
Nearby Amenities
Near highway
Near public transit
Near schools
Near shopping
Near parks
Rental Information
long term rental only
Exterior
bbq area
covered patio
fenced yard
privacy fence
security gate
patio
gated community
community pool
gym
sauna
playground
Indoor
open floor plan
vaulted ceilings
tile floors
ceiling fan
split system
sliding glass doors
balcony
laundry room
built in shelving
oven
dishwasher
microwave
split system
gated entry
double story
Listed on 15 Sep 2026
Property Location Map
What does the location around this property look like
Compare room sizes. Is this property the right size for your next home or investment.
Property Transaction History
Sale and rental history records
No history available.
Automated Property Valuation
What Is This Home Worth Right Now?
Don't rely on baseless online estimates. We compare real sale prices in this suburb, adjust for the home's specific features, index its own sales history forward with suburb growth, then calculate today's valuation.
Estimated Value
--
--
----
Calculating…
---- --
The estimated valuation process
HomePost estimated valuations are thorough and transparent.
Comparable Median
--
--
The current median sale price for directly comparable homes in this suburb.
Market Growth
--
--
--
Last Sale
--
--
--
Value Density
--
--
--
Rental Potential
--
--
--
Price Positioning
How This Property Compares
This property in this suburb, measured against the median sale price in its own suburb and the surrounding suburbs. Use these benchmarks to judge whether the asking price sits below, at, or above the local market.
Listing Price Witheld
Unfortunately, this listing does not have a price set. You may contact the agent to discuss.
Provide your own estimate of the expected sale price to compare it against the local market.
$
Enter a whole-dollar amount (anywhere from $100,000 upward).
--%
vs suburb median
Based on your estimate
Calculating…
This Property
--
--
Suburb Median
--
2026
Price vs Surrounds
--
vs nearby avg
Suburb Affordability
--
Median by Suburb (2026)
Where each suburb's current median lands, against this property's asking price and the all-suburbs average. Hover any bar or line for detail.
This suburbSurrounding suburbThis propertyAll-suburbs average
Median by Bedroom
The suburb's 2026 median across bedroom counts, with this property's price and the all-suburbs average overlaid. Hover any bar or line for detail.
This property's typeOther bedroom countsAsking priceAll-suburbs average
Upfront Buying Costs
The True Cost of Buying This Home
The advertised price is only part of the story. Stamp duty, government registration fees and standard buying costs in this state all need to be paid on or before settlement. Here's what to budget for on top of the purchase price.
The largest upfront tax, calculated on the purchase price and paid to the state revenue office at settlement.
Registration
mortgage fees
--
Government land-registry charges to record the transfer of title and register your mortgage.
Other Costs
legal, inspections
--
Conveyancing, building and pest inspections, searches and other typical costs of buying a home.
All-In Cost
--
--
Purchase price plus all extra estimated upfront costs included. Use the calculator for better accuracy.
Breakdown
price vs. extras
Predict the Sale Price
What do you think this house will sell for? Your opinion helps other buyers gauge the real market value.
25% LessListed25% More
Listed Price
$0
—
Your Prediction
$0
At listed price
Right on the money
You think the property will sell exactly at the listed price. A confident, steady prediction.
Thanks — your prediction has been submitted!
We've recorded your estimate of $0.
Australian property
AI generated content may be incorrect. No liability accepted.
Saved answers
Bookmark the answers that matter — they stay saved across every chat and property, ready when you compare homes or talk to your agent, broker or lender.
Chat History
Community
Posts
Sort by
Loading posts...
ARUNDEL Statistics
Exclusive, in-depth suburb statistics presented to inform your decisions with confidence. Compare suburbs side by side to uncover the insights that matter most.
Suburb Statistcs:
Comprehensive data analysis and market insights.
View Statistics As:
Compare Suburb:
Median House Price History
Historical performance of median house prices broken down by bedroom count.
Annual Sales Volume
Total number of houses sold per year.
Total Return Profile (Yield + Growth)
Combines Rental Yield with Capital Growth across timeframes.
Market Heat & Competition
Auction Clearance Rates and Demand/Supply Ratio.
Risk Factors: Vacancy & Supply
Vacancy Rate and Stock on Market.
Property Price Breakdown by Type
Compare median prices across Houses, Units, Townhouses, and Land.
Weekly Rent by Bedrooms
Median weekly rent for 1-bed through 4-bed properties.
Yield & Growth: House vs Unit
Direct comparison of yield % and rent growth %.
Rental Demand Pressure
Applications per listing, days to lease, and inspection attendees.
Invaluable insight into one of the most important decisions you will ever make.
Sector
Level
Gender
Loading schools & catchments…
Catchment boundaries
PrimarySecondary
Schools
Government
Catholic
Independent
N
0 to compare
Side-by-Side Comparison
Calculators
Use our sophisticated calculators to help you make tactical real estate decisions.
Premium
Is This Investment Right for You?
Take control of your property investment decisions without relying on financial planners or buyer's agents with exclusive access to our highly sophisticated, institution-grade Property Investment Analyser.
Fully updated to reflect the latest Federal Budget provisions, it analyses rental yield, cash flow, and overall Return on Investment (ROI), giving you the clarity to assess whether a property truly aligns with your financial objectives.
The True Cost of Buying this Property
See every real cost of ownership — purchase fees, holding costs, and hidden expenses.
Mortgage Calculator
Estimate your monthly repayments and full amortization schedule.
Buyer Fees Calculator
Calculate stamp duty, LMI, and all upfront purchase costs.
Mortgage Affordability & Borrowing Capacity
Discover how much you can borrow based on income and expenses.
Refinance Savings Calculator
Compare your current loan with a new one to save long-term.
Select a calculator above to get started.
Investment Calculator
Investment Viability Engine · 2026 Tax Rules
Is this property worth investing in?
Fill in the essentials on the left. The verdict and your projected take-home profit update live on the right.
Select property type and purchase date to see which tax regime applies.
1 The Property
$
$
2 Your Situation
$
%
$
%
yrs
%
yrs
3 Costs & Assumptions
These are pre-filled from suburb data and sensible defaults. Open to fine-tune — otherwise leave as-is.
%
%
$
$
$
$
$
%
$
%
%
%
d
%
%
4 Advanced (optional)
Deposit funding & existing equityIs the deposit cash, or borrowed against another property?
$
%
Interest on the borrowed deposit is also tax-deductible and is added to your gearing position. Your true out-of-pocket cash is reduced by whatever portion you borrow.
Borrowing capacity & serviceabilityCan you actually get the loan? Lender stress test.
$
$
%
%
Ownership structure & income splittingSole, joint (split income), company or trust?
%
$
A negatively geared property usually works best held by the higher earner; a positively geared one benefits from being split to the lower earner. This is general information only.
Land tax (NSW)Annual holding cost on combined land value over the threshold.
$
$
NSW 2026: nil up to $1,075,000 combined land value, then $100 + 1.6% of the excess, rising to $88,036 + 2% premium rate above $6,571,000. Computed land tax replaces the figure in section 3.
Cash buffer & risk capacityCould you survive vacancy, rate rises and repairs?
$
%
wk
Calculating…Verdict
?
—/100
Your take-home profit over — yrs
?
—
rent cash flow + capital gain − all costs & tax
If sold (yr —)
?
—
net rent + gain after CGT, selling costs & loan payout
If kept (yr —)
?
—
net rent + unrealised equity gain (no sale, no CGT yet)
Cash invested
?
—
Return on cash
?
—
Annualised (IRR)
?
—
Est. sale price (yr —)
?
—
After-tax weekly cash flow (yr 1)?
—
Pre-tax / yr
?
—
Tax effect
?
—
After-tax / yr
?
—
Loan amount
?
—
—
Net rental yield
?
—
—
Gearing position
?
—
—
Break-even rent
?
—
to be cash-flow neutral
Projected net sale proceeds after CGT
?
—
—
Score breakdown
?
Comparing Common Investments
?
What this shows
Property value (grey bars, left axis) is the projected market value each year using your capital-growth assumption. The capital profit if sold line (coral, left axis) is the money you'd actually walk away with that year after repaying the loan, paying selling costs, paying CGT, and getting back the cash you put in. The rent collected line (teal, right axis) is gross annual rent received, grown at your rent-growth assumption.
What this shows
Three views of how the position evolves year by year. Property value (dashed) shows the asset growing at your capital-growth rate. Equity (coral) is value minus loan balance — how much of the property you actually own. Cumulative cash flow (teal) is the running total of all after-tax rent (positive) or top-ups (negative) you've put in since day one.
What this shows
The yearly cash position after every cost and tax effect. Green bars = positive years (the property paid you). Red bars = years you had to top it up from your pocket. This is the most honest picture of what holding the property feels like on a year-to-year basis.
What this shows
Where every dollar of the projected sale price goes. Net to you is what lands in your bank account; the rest is consumed by loan payout, selling costs and capital gains tax. The CGT slice depends on which regime applies (50% discount, indexation + 30% min tax, or a split of the two).
What this shows
How fragile your outcome is to the capital-growth assumption — the single biggest swing factor in any property forecast. Each point on the line re-runs the entire model at a different growth rate. Where the line crosses the dashed zero, that's roughly the growth rate needed just to break even over your hold period.
What this shows
The same upfront cash invested four different ways, held the same number of years. The property includes all rent, costs, tax and the final sale (after CGT and loan payout). The ASX 200 ETF compounds at its assumed total return; the gold line compounds at gold's long-run average; the inflation line is what you need to just preserve your purchasing power. Any year the property bleeds cash, that shortfall is invested in the comparison asset too (so they get the same total dollars over the life of the deal). Gains on the comparison assets are taxed under the same 2026-Budget CGT regime that applies to shares and ETFs — the transitional split (50% discount on the pre-1 Jul 2027 portion, then cost-base indexation + 30% minimum tax on the post-1 Jul 2027 portion), since non-property assets are never grandfathered.
What this shows
The full year-by-year ledger. Cash flow is pre-tax (rent minus all cash costs); tax effect is the value of any deduction or the tax bill on net profit; after-tax is the actual dollars in or out of your account that year. Cumulative is the running total.
About this model
Reflects the 2026 Federal Budget proposals (announced 12 May 2026): from 1 July 2027, negative gearing on
established residential property bought after 7:30pm 12 May 2026 can only offset rental income / residential
property gains (excess losses carry forward), and the 50% CGT discount is replaced by cost-base indexation plus a 30%
minimum tax on the real gain accruing after 1 July 2027. The CGT change applies to all CGT assets (shares, ETFs,
gold, crypto), not just property, so the comparison assets are taxed on the same basis. New builds retain
full negative gearing and the choice of the 50% discount. Properties contracted on/before 12 May 2026 are
grandfathered. The main residence, superannuation funds and widely-held trusts are exempt. These are proposed rules
that may change in legislation. Resident tax rates 2025–26 are used (incl. 2% Medicare levy). This is general
information, not financial, tax or legal advice — consult a licensed adviser before acting.
Purchase Cost Calculator
The True Cost of Buying this Property
Beyond the sale price, Australian property buyers face stamp duty, legal fees, inspections, loan charges and more. Adjust the purchase price and your state to see the full picture.
Purchase Price
$850,000
AUD
$100K$5M
Property State
Your Situation
Total Additional Costs
On top of the $850,000 purchase price in NSW
Extra Costs
$52,000
All-In Cost
$902,000
% of Price
6.1%
How these figures are calculated
Stamp Duty (Transfer Duty): Calculated using each state's 2024–25 residential transfer duty brackets for owner-occupiers. First home buyer concessions and investor surcharges are applied where selected.
Lenders Mortgage Insurance (LMI): Estimated at approximately 1.5–2.5% of the loan amount, assuming an 85% LVR. Actual LMI depends on your lender, LVR and loan size.
Conveyancing / Legal Fees: Typical range of $1,500–$3,000 covering contract review, searches and settlement. We use a mid-range estimate.
Building & Pest Inspection: Typically $400–$800 combined for a standard residential property.
Loan Application & Mortgage Registration: Includes bank application fees ($300–$600), mortgage registration (state-based, usually $150–$230) and transfer registration fees.
Council & Water Rate Adjustments: Estimated at around 0.1% of the purchase price — the buyer typically reimburses the seller for pre-paid rates.
These estimates are indicative only. Always confirm exact figures with your conveyancer, broker and the relevant state revenue office before committing to a purchase.
Mortgage Calculator
—Total Paid
—Total Interest
—Payoff Date
—Interest / Principal
Loan Amount—
Monthly Repayment—
Total of Payments—
Down Payment %—
Buyer Fees Calculator
—Stamp Duty
—Total Upfront Fees
—Lenders Mortgage Insurance
—Fees % of Price
Stamp Duty—
Transfer & Registration—
Other Fees—
Total Buyer Fees—
Disclaimer: This calculator provides estimates only based on standard published rates for 2025-26. Actual stamp duty may vary based on individual circumstances, concession eligibility, and contract dates. LMI is a rough estimate only — actual premiums vary by lender, LVR, and loan size. Always verify with your state’s revenue office and seek professional advice before purchasing.
Disclaimer: This calculator provides an estimate only and does not constitute a quote or loan approval. Calculations are based on standard APRA guidelines (including a 3.0% interest rate assessment buffer) and 2025–26 Australian resident tax rates. Lenders may apply their own specific Household Expenditure Measure (HEM) rules, risk margins, and varying credit card assessment rates (typically 3.8% of the limit). Rental income is shaded to 80%. Always speak to a licensed mortgage broker or lender for an exact assessment.
Refinance Savings Calculator
—New Monthly Repayment
—Monthly Savings
—Net Lifetime Savings
—Break-Even Point
Current Repayment—
New Repayment—
Monthly Savings—
Net Lifetime Savings—
Disclaimer: This calculator provides estimates only. It assumes interest rates remain constant for the life of the loan and does not account for offset accounts or extra repayments. Refinance costs vary by lender and state (typically including a discharge fee, application fee, and government mortgage registration fees). If your loan balance is above 80% of your property's value, you may also be required to pay Lenders Mortgage Insurance (LMI) when refinancing. Always seek professional financial advice.
Listings Nearby
Loading related listings...
DISCLAIMER: All listing information on HomePost is provided "as is" without any guarantee or warranty as to accuracy, completeness, validity or reliability, and content may be generated by Artificial Intelligence (AI) and may be inaccurate or incorrect. To the maximum extent permitted by law, HomePost excludes all liability for any loss or damage arising from reliance on this information presented, and you should conduct your own independent due diligence and research before making any decisions. To use our platform and access publicly presented information, you agree to our Terms and Conditions.