164 ARCTIC STREET LAKE CATHIE NSW 2445

HOUSE FOR SALE

$1,050,000

Estimated Valuation

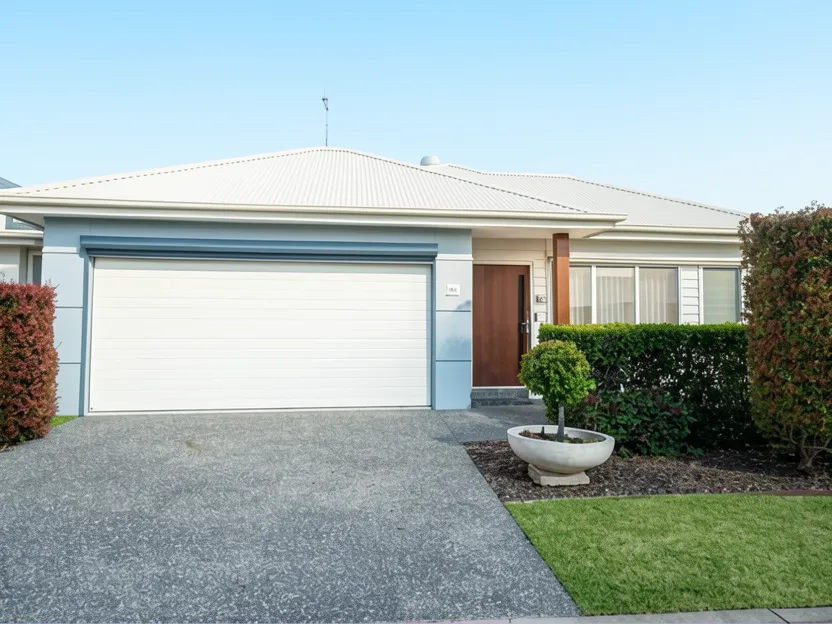
164 ARCTIC STREET LAKE CATHIE NSW 2445 Property Photo
Bedrooms

2

Bathrooms

2

Car Space

2

Land Size

-

Year Built

-

Property Type

House

Active
Listing Price

$990,000

Listed By
Ocean Club Resort - LAKE CATHIE
Immaculately presented Noosa-style home in Lake Cathie featuring extensive premium upgrades including automated blinds and oak flooring. This turnkey property offers two bedrooms, two bathrooms, and two private alfresco areas, making it an ideal choice for buyers seeking a low-maintenance coastal lifestyle.

Description

Located in the sought-after coastal community of Lake Cathie, this Noosa-inspired single-storey residence has been extensively upgraded to offer a premium and turnkey lifestyle. The home features two bedrooms, each with ample storage, and two full bathrooms, including a private ensuite for the main bedroom. The interior showcases premium oak flooring, high ceilings, and an abundance of natural light flowing through the open-plan living and dining area.

The kitchen is equipped with quality appliances and white cabinetry, opening onto an alfresco area finished with decorative stencil concrete. Additional premium features include automated blinds throughout the main living areas, a versatile study/media room, and solar power. The exterior boasts low-maintenance landscaping and two separate private entertaining zones, one of which is sheltered by an automated ZipTrack garage screen.

With recent improvements such as fresh internal and external paint, brand new bedroom carpets, and an extended PebbleCrete entrance, the property is immaculate and move-in ready. Ideally positioned moments from shops, cafés, and beaches, this home offers a low-maintenance lifestyle with high-end finishes.

Property Style & Condition

Overall
contemporary
excellent
Condition
Exterior
modern
excellent
Condition
Livingroom
contemporary
excellent
Condition
Bedrooms
modern
excellent
Condition
Kitchen
contemporary
excellent
Condition
Bathroom
modern
excellent
Condition
Yard
landscaped
good
Condition

Key Features

Two bedrooms with brand new carpets
Two bathrooms (ensuite + main)
Premium oak flooring throughout
Open plan living and dining area
Automated blinds (kitchen, media room, main bedroom)
Solar power system
Double garage with mezzanine storage
Automated ZipTrack garage screen
Two private alfresco entertaining areas
Decorative stencil concrete on alfrescos
Extended PebbleCrete entrance
Versatile study/media room
Quality window furnishings

Specifications

Property Details
Property Type House
Stories 1
Parking Type attached garage, driveway
Construction brick
Windows double pane
Gas natural gas
Internet nbn
Location & Setting
Setting suburban
Lot Position interior lot
Beach Proximity within walking distance
Nearby Amenities
Near beach
Near shopping
Near restaurants
Rental Information
long term rental only

Exterior

alfresco
patio
fenced yard
double carport
driveway
solar panels

Indoor

open floor plan
hardwood floors
carpet
walk in closet
kitchen island
laundry room
home office
primary suite
ensuite bathroom
ceiling fan
recessed lighting
sliding glass doors
built in shelving
refrigerator
oven
dishwasher
microwave
central
ceiling fan
smart home
single story
Listed on 01 Sep 2026

Property Location Map

What does the location around this property look like

N
    Property     LAKE CATHIE     LGA

Floorplan & Spaces

Compare room sizes. Is this property the right size for your next home or investment.

Property Transaction History

Sale and rental history records

No history available.
Price Positioning

How This Property Compares

This property in this suburb, measured against the median sale price in its own suburb and the surrounding suburbs. Use these benchmarks to judge whether the asking price sits below, at, or above the local market.

Predict the Sale Price

What do you think this house will sell for? Your opinion helps other buyers gauge the real market value.


25% Less Listed 25% More
Listed Price
$0
—
Your Prediction
$0
At listed price
Right on the money
You think the property will sell exactly at the listed price. A confident, steady prediction.
Australian property
AI generated content may be incorrect. No liability accepted.

Saved answers

Bookmark the answers that matter — they stay saved across every chat and property, ready when you compare homes or talk to your agent, broker or lender.

Chat History

Community

Posts

Sort by
Loading posts...

LAKE CATHIE Statistics

Exclusive, in-depth suburb statistics presented to inform your decisions with confidence. Compare suburbs side by side to uncover the insights that matter most.

Suburb Statistcs:

Comprehensive data analysis and market insights.

View Statistics As:

Property Price History

Track the market value of family homes over the last 10 years.

Market Activity (Sales Volume)

Number of homes sold annually.

Education Quality & Safety Index

School Quality (ICSEA) vs Safety Index.

Community Stability

High Owner Occupier % and Family Household %.

Livability Scores

Walkability, Transit Access, and Green Space.

Crime Breakdown vs State Average

Key crime categories per 100K residents.

Local School ICSEA Scores

Individual school ICSEA scores vs national average (1000).

Age Distribution Profile

Population age bands.

Household Composition

Couples with kids, couples without, single parent, etc.

Health & Wellbeing Indicators

Key health metrics: obesity, smoking, etc.

Commute & Transport Mix

How residents get to work: car, train, bus, walk, WFH.

Environment & Natural Hazards

Air quality, tree canopy, parks coverage.

Income vs Cost of Living

Median household income compared to weekly expenses.

Childcare Availability & Quality

Centres count, NQS ratings, avg daily fees.

Economy & Income

Location Profile

Education

Comprehensive Suburb Statistics

Local Places & Amenities

Explore the essentials LAKE CATHIE has to offer. Distances are measured from the suburb centre.

Discovering local amenities…

Crime in suburb of Lake Cathie NSW

Exclusive access to crime statistics from 2020 to 2025.
5-Year Crime Trend (2020 - 2024)

Crime Composition (2024)

Violent vs Property vs Other

Top 10 Offense Types (2024)

Victimization Probability

Violent Crime Chance 1 in X
Property Crime Chance 1 in X
State Average (Violent) 1 in 84

Schools within the catchment Lake Cathie NSW

Invaluable insight into one of the most important decisions you will ever make.

Sector
Level
Gender
Loading schools & catchments…
N
0 to compare

Side-by-Side Comparison

Calculators

Use our sophisticated calculators to help you make tactical real estate decisions.

Mortgage Calculator

Estimate your monthly repayments and full amortization schedule.

Buyer Fees Calculator

Calculate stamp duty, LMI, and all upfront purchase costs.

Mortgage Affordability & Borrowing Capacity

Discover how much you can borrow based on income and expenses.

Refinance Savings Calculator

Compare your current loan with a new one to save long-term.

Select a calculator above to get started.

Investment Calculator

  Investment Viability Engine · 2026 Tax Rules

Is this property worth investing in?

Fill in the essentials on the left. The verdict and your projected take-home profit update live on the right.

Select property type and purchase date to see which tax regime applies.

1 The Property

$
$

2 Your Situation

$
%
$
%
yrs
%
yrs

3 Costs & Assumptions

These are pre-filled from suburb data and sensible defaults. Open to fine-tune — otherwise leave as-is.
%
%
$
$
$
$
$
%
$
%
%
%
d
%
%

4 Advanced (optional)

Deposit funding & existing equityIs the deposit cash, or borrowed against another property?
$
%
Interest on the borrowed deposit is also tax-deductible and is added to your gearing position. Your true out-of-pocket cash is reduced by whatever portion you borrow.
Borrowing capacity & serviceabilityCan you actually get the loan? Lender stress test.
$
$
%
%
Ownership structure & income splittingSole, joint (split income), company or trust?
A negatively geared property usually works best held by the higher earner; a positively geared one benefits from being split to the lower earner. This is general information only.
Land tax (NSW)Annual holding cost on combined land value over the threshold.
$
$
NSW 2026: nil up to $1,075,000 combined land value, then $100 + 1.6% of the excess, rising to $88,036 + 2% premium rate above $6,571,000. Computed land tax replaces the figure in section 3.
Cash buffer & risk capacityCould you survive vacancy, rate rises and repairs?
$
%
wk
Calculating…Verdict ?
—/100
Your take-home profit over — yrs ?
—
rent cash flow + capital gain − all costs & tax
If sold (yr —) ?
—
net rent + gain after CGT, selling costs & loan payout
If kept (yr —) ?
—
net rent + unrealised equity gain (no sale, no CGT yet)
Cash invested ?
—
Return on cash ?
—
Annualised (IRR) ?
—
Est. sale price (yr —) ?
—
After-tax weekly cash flow (yr 1) ?
—
Pre-tax / yr ?
—
Tax effect ?
—
After-tax / yr ?
—
Loan amount ?
—
—
Net rental yield ?
—
—
Gearing position ?
—
—
Break-even rent ?
—
to be cash-flow neutral
Projected net sale proceeds after CGT ?
—
—
Score breakdown ?
Comparing Common Investments ?
What this shows
Property value (grey bars, left axis) is the projected market value each year using your capital-growth assumption. The capital profit if sold line (coral, left axis) is the money you'd actually walk away with that year after repaying the loan, paying selling costs, paying CGT, and getting back the cash you put in. The rent collected line (teal, right axis) is gross annual rent received, grown at your rent-growth assumption.
What this shows
Three views of how the position evolves year by year. Property value (dashed) shows the asset growing at your capital-growth rate. Equity (coral) is value minus loan balance — how much of the property you actually own. Cumulative cash flow (teal) is the running total of all after-tax rent (positive) or top-ups (negative) you've put in since day one.
What this shows
The yearly cash position after every cost and tax effect. Green bars = positive years (the property paid you). Red bars = years you had to top it up from your pocket. This is the most honest picture of what holding the property feels like on a year-to-year basis.
What this shows
Where every dollar of the projected sale price goes. Net to you is what lands in your bank account; the rest is consumed by loan payout, selling costs and capital gains tax. The CGT slice depends on which regime applies (50% discount, indexation + 30% min tax, or a split of the two).

What this shows
How fragile your outcome is to the capital-growth assumption — the single biggest swing factor in any property forecast. Each point on the line re-runs the entire model at a different growth rate. Where the line crosses the dashed zero, that's roughly the growth rate needed just to break even over your hold period.

What this shows
The same upfront cash invested four different ways, held the same number of years. The property includes all rent, costs, tax and the final sale (after CGT and loan payout). The ASX 200 ETF compounds at its assumed total return; the gold line compounds at gold's long-run average; the inflation line is what you need to just preserve your purchasing power. Any year the property bleeds cash, that shortfall is invested in the comparison asset too (so they get the same total dollars over the life of the deal). Gains on the comparison assets are taxed under the same 2026-Budget CGT regime that applies to shares and ETFs — the transitional split (50% discount on the pre-1 Jul 2027 portion, then cost-base indexation + 30% minimum tax on the post-1 Jul 2027 portion), since non-property assets are never grandfathered.
What this shows
The full year-by-year ledger. Cash flow is pre-tax (rent minus all cash costs); tax effect is the value of any deduction or the tax bill on net profit; after-tax is the actual dollars in or out of your account that year. Cumulative is the running total.

About this model

Reflects the 2026 Federal Budget proposals (announced 12 May 2026): from 1 July 2027, negative gearing on established residential property bought after 7:30pm 12 May 2026 can only offset rental income / residential property gains (excess losses carry forward), and the 50% CGT discount is replaced by cost-base indexation plus a 30% minimum tax on the real gain accruing after 1 July 2027. The CGT change applies to all CGT assets (shares, ETFs, gold, crypto), not just property, so the comparison assets are taxed on the same basis. New builds retain full negative gearing and the choice of the 50% discount. Properties contracted on/before 12 May 2026 are grandfathered. The main residence, superannuation funds and widely-held trusts are exempt. These are proposed rules that may change in legislation. Resident tax rates 2025–26 are used (incl. 2% Medicare levy). This is general information, not financial, tax or legal advice — consult a licensed adviser before acting.
Purchase Cost Calculator

The True Cost of Buying this Property

Beyond the sale price, Australian property buyers face stamp duty, legal fees, inspections, loan charges and more. Adjust the purchase price and your state to see the full picture.

Purchase Price
$850,000
AUD
$100K $5M
Property State
Your Situation
Total Additional Costs
On top of the $850,000 purchase price in NSW
Extra Costs
$52,000
All-In Cost
$902,000
% of Price
6.1%
How these figures are calculated

Stamp Duty (Transfer Duty): Calculated using each state's 2024–25 residential transfer duty brackets for owner-occupiers. First home buyer concessions and investor surcharges are applied where selected.

Lenders Mortgage Insurance (LMI): Estimated at approximately 1.5–2.5% of the loan amount, assuming an 85% LVR. Actual LMI depends on your lender, LVR and loan size.

Conveyancing / Legal Fees: Typical range of $1,500–$3,000 covering contract review, searches and settlement. We use a mid-range estimate.

Building & Pest Inspection: Typically $400–$800 combined for a standard residential property.

Loan Application & Mortgage Registration: Includes bank application fees ($300–$600), mortgage registration (state-based, usually $150–$230) and transfer registration fees.

Council & Water Rate Adjustments: Estimated at around 0.1% of the purchase price — the buyer typically reimburses the seller for pre-paid rates.

These estimates are indicative only. Always confirm exact figures with your conveyancer, broker and the relevant state revenue office before committing to a purchase.

Mortgage Calculator

$
$
%
yrs
$
$
— Total Paid
— Total Interest
— Payoff Date
— Interest / Principal
Loan Amount —
Monthly Repayment —
Total of Payments —
Down Payment % —

Buyer Fees Calculator

$
$
$
$
$
— Stamp Duty
— Total Upfront Fees
— Lenders Mortgage Insurance
— Fees % of Price
Stamp Duty —
Transfer & Registration —
Other Fees —
Total Buyer Fees —
Disclaimer: This calculator provides estimates only based on standard published rates for 2025-26. Actual stamp duty may vary based on individual circumstances, concession eligibility, and contract dates. LMI is a rough estimate only — actual premiums vary by lender, LVR, and loan size. Always verify with your state’s revenue office and seek professional advice before purchasing.

Mortgage Affordability & Borrowing Capacity Calculator

$
$
$
$
$
$
%
Calculating…
Stretched Tight Comfortable Easy
— Max Borrowing Capacity
— Loan Required
— Monthly Repayment
— Monthly Leftover
Monthly Net Income —
Living Expenses & Debts —
Mortgage Repayment —
Monthly Leftover —
Disclaimer: This calculator provides an estimate only and does not constitute a quote or loan approval. Calculations are based on standard APRA guidelines (including a 3.0% interest rate assessment buffer) and 2025–26 Australian resident tax rates. Lenders may apply their own specific Household Expenditure Measure (HEM) rules, risk margins, and varying credit card assessment rates (typically 3.8% of the limit). Rental income is shaded to 80%. Always speak to a licensed mortgage broker or lender for an exact assessment.

Refinance Savings Calculator

$
$
— New Monthly Repayment
— Monthly Savings
— Net Lifetime Savings
— Break-Even Point
Current Repayment —
New Repayment —
Monthly Savings —
Net Lifetime Savings —
Disclaimer: This calculator provides estimates only. It assumes interest rates remain constant for the life of the loan and does not account for offset accounts or extra repayments. Refinance costs vary by lender and state (typically including a discharge fee, application fee, and government mortgage registration fees). If your loan balance is above 80% of your property's value, you may also be required to pay Lenders Mortgage Insurance (LMI) when refinancing. Always seek professional financial advice.

Listings Nearby

DISCLAIMER: All listing information on HomePost is provided "as is" without any guarantee or warranty as to accuracy, completeness, validity or reliability, and content may be generated by Artificial Intelligence (AI) and may be inaccurate or incorrect. To the maximum extent permitted by law, HomePost excludes all liability for any loss or damage arising from reliance on this information presented, and you should conduct your own independent due diligence and research before making any decisions. To use our platform and access publicly presented information, you agree to our Terms and Conditions.
Success!